
Table
- Option #1: WP Business Intelligence
- Option #2: WPBakery (formerly Visual Composer)
- Option #3: Divi – Elegant Chart Plugin
Are you looking to add charts and graphs to your WordPress blog posts and pages? You may have found that options for adding these are limited or you might be confused by the various offerings available. We are going to breakdown exactly how to add certain types of charts and graphs to your WordPress content in this article. Below you will find a variety of options including using our plugin, free plugin options, elements built into page builders, and even paid plugins by our competitors.
Each WordPress plugin is different and some may not meet your requirements. Read through each one here before selecting a plugin to go with. This article is continuously updated to remove plugins that are no longer being updated or add update what features each one has.
1. WP Business Intelligence
This is our plugin and it comes in two varities, Free and Pro. The free option allows any WordPress site to immediately add charts and graphs to their website using a third-party database or data from the WordPress database. This plugin is constantly updated with new features being added to the Pro version all the time and some of those features ultimately being migrated to the free version to help WordPress publishers better express their statistical data in graph format.
This is the only plugin that uses the Britecharts library which produces colorful and gorgeous charts.
WP Business Intelligence is designed for internal / external reporting on business data and insights. Using the WP Business Intelligence plugin, your own live database, and database queries you can quickly and easily build data driven dashboards to share inside of the company and with your investors. This means you can build dashboards to display actionable near-real time insights to make business decisions with minimal effort. To create the best dashboards possible we recommend using the Pro version of the plugin.
While this plugin is focused on Business Intelligence use cases, the free version is a perfect way to add charts and graphs from your database to any blog post or page on your website. Our users use the free plugin to display all kinds of in-depth data, see our Showcase page for examples.
The Free version has its limits but allows WordPress developers to quickly add various chart types from the WordPress datbase including:
- Bar Charts
- Line Charts
- Donut Charts
- Grouped Bar Charts
Get the free version on the WordPresss repository here: WP Business Intelligence Lite
The Pro or premium version of our plugin comes with the advanced feature of allowing developers to create charts and graphs using a live independent database including these db types:
- MySQL
- MariaDB
- Postgres
- MS SQL
The Pro version also comes with the ability to build a data table and includes more types of charts and graphs from your live database. Here is everything you can create with the Pro version:
- Stacked Area Charts
- Stacked Bar Charts
- Sparkline Charts
- Data Tables
- Bar Charts
- Line Charts
- Donut Charts
- Grouped Bar Charts
Get the Pro version here: Buy WP Business Intelligence Pro
Price: $599 / year
Here is a live example of the plugin in action creating a stacked area chart from a live database
2. WPBakery (formerly Visual Composer)
WPBakery is one of the best page builder plugins for WordPress. This plugin makes it a snap to add custom CSS to specific pages, build complicated page layouts, add paralax actions and other things to your pages, and add rich content elements.
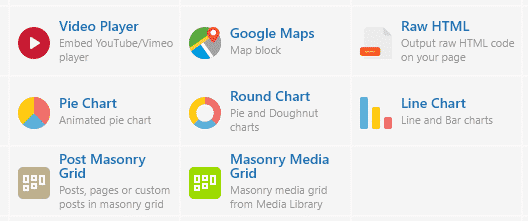
WPBakery allows users to add animated Pie charts, Doghnut charts, Line charts, and Bar charts standard inside of the page builder. Their system uses the Chart.js library to produce charts and graphs, a common charting library used on the web today.
With WPBakery you can edit most every part of the chart including the color of each section, the y-axis values, the x-axis values, the overall style of the chart (Flat or Modern) and the animation.
If you love the idea of using WPBakery for your chart or graph needs, but need a chart option that does not come standard, WPBakery sells a premium add-on for $20 / year that gives you access to the full suite of Chart.js chart options.
This makes WPBakery an excellent choice for simple yet stunning charts if you want to combine relatively static values with amazing visuals.
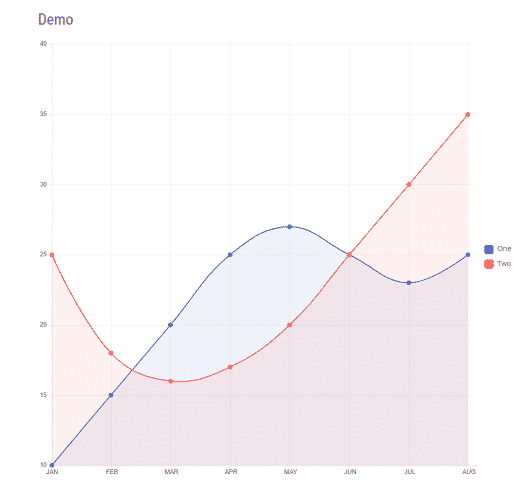
Here’s a screenshot of the demo line chart made by WPBakery:
3. Divi – Elegant Chart Plugin
If your website uses the Divi theme or the Divi page builder by Elegant Themes you can use the plugin Elegant Chart to add charts to your website.
Elegant Chart comes with a limited set of chart options featuring six different chart types including bar charts, pie charts, radar charts, and donut charts. The plugin allows users to export charts SVG, PNG, or CSV fiiles. It also comes with editable tooltips and animation for the various charts.
This isn’t a free option, but it is inexpensive at only $7 and comes with a GPL license for unlimited website uses.
The plugin also appears to be well-rated and frequently updated.
All of this makes Elegant Chart the perfect solution to add charts and graphs to Divi powered WordPress websites that need just a few charts types on a minimal budget.

last updated: 9/4/2021